Data is one of the most valuable assets for contemporary organizations, but the real benefit shows up only when businesses turn raw information into useful conclusions. In this regard, Microsoft Power BI has been extremely useful. Power BI combines data integration with visualization, reporting, and analytics to empower organizations to improve the decision-making process in all business areas.
In the modern world, the volume of data being created is so large that analytics has ceased being an area of competition and strategy and is instead becoming a basic necessity of doing business. Data is created in organizations from customer interactions, financial transactions, and from the supply chain, cloud applications, and the Internet of Things (IoT).
Statistics indicate that by 2026, the global data total will reach approximately 221 zettabytes, representing a 61% increase compared to 2023 levels. This rapid data growth is creating significant challenges for organizations in managing, storing, and extracting value from their information. Consequently, over 70% of enterprises are expected to increase their investments in advanced analytics platforms and AI-driven tools to gain actionable insights and maintain a competitive edge.
Data-centric strategies are now prerequisites of modern business success. Researchers found that more data-led companies tend to share better decision results, and the uplift shows up about three times as fast as for their less data-focused peers. So, leaders don’t just lean on intuition anymore, or on old stories from past quarters. They use real-time dashboards, predictive analytics, and AI-driven insights to spot opportunities, mitigate risks, and optimize operations.
Power BI is evidence of the changing focus on business data. Every time technology evolves, we see the advent of business self-service data in real-time, high-governance embedded predictive analytics exponentially changing the expectations a business has from a data analytics platform. Organizations that cannot evolve with time and technology will see enterprises struggle with their data.
Many enterprises are partnering with providers of Power BI consulting services to stay one step ahead of modern innovations and to apply best practices in a more reliable way. It’s crucial to grasp the recent Power BI trends for creating a future-ready analytics plan. Here, we look at the biggest trends that are changing Power BI right now, and we also discuss how these trends are influencing data analytics and business intelligence.

1. AI-Powered Analytics and Copilot Integration
AI-Powered analytics and integrated Copilots reside within the most established Power BI future trends. Organizations can increase the speed and performance of insight generation, forecasts, and decisions with the assistance of these tools.
⇒ How AI is Transforming Business Intelligence
◈ Rise of artificial intelligence in analytics platforms
Artificial Intelligence has been developing to become a regular feature in analytics. Organizations can now rely on AI technology to assist with the laborious tasks of data analysis, trend identification, anomaly detection, and insight generation with minimal effort.
◈ Benefits of AI-driven insights
AI insights now provide the ability to identify risks and opportunities within and across data to meet forecast expectations and allow better strategic decisions with less bias and greater support.
⇒ Microsoft Copilot in Power BI
◈ Natural language querying
Natural language querying offers conversational methods to ask business-related questions in order to receive immediate visual data. Users do not need technical knowledge to write queries, which allows them to have data insights more quickly.
◈ Automated report generation
Automated report generation allows users to request highly functional dashboards and reports using simple language. This significantly saves time and is more efficient for analytics teams and standardizes reporting practices.
◈ AI-assisted data exploration
AI-assisted data exploration marks data and suggests patterns, trends, and anomalies to assist users in finding useful data that is hard to find in traditional analyses of data, which are based on manual processes.
⇒ Business Benefits
◈ Faster decision-making
The ability of AI to quickly process data and generate insights allows leaders to analyze the state of the business and changes in the market and make decisions with certainty and at a much quicker pace.
◈ Reduced dependency on technical teams
AI-based solutions empower business users to self-serve analytics by creating their own reports and examining trends without the need to rely on tech specialists. This, in turn, allows analytics teams to concentrate on initiatives with greater impact.
◈ Improved productivity
Automation of those repetitive analytics chores really cuts down on the manual workload, so employees can put more time into decoding insights, tackling business problems, and pushing strategic results that help the organization grow.
2. Self-Service Business Intelligence Expansion
Self-service business intelligence lets employees independently access information, craft reports, draw conclusions, and make quicker, more informed choices, so it becomes one of the most influential Power BI trends in the current time.
⇒ Empowering Non-Technical Users
◈ Democratization of data analytics
Self-service analytics helps remove the traditional barriers to data access, so employees in different departments can explore information on their own, discover hidden insights, and make decisions using evidence, without needing huge technical know-how or constant help from IT.
◈ User-friendly dashboard creation
Intuitive dashboard design tools let business users create meaningful visualizations fast, which helps teams monitor performance, follow objectives, and communicate insights effectively, without always having to rely on specialized development resources.
⇒ Low-Code and No-Code Features
◈ Drag-and-drop report building
Drag and drop functionality lets users put together interactive reports effortlessly by shuffling visuals, metrics, and filters around, which can cut down on the development complexity, while also speeding up report creation and boosting overall user adoption.
◈ Simplified data modeling
Simplified data modeling is all about helping users connect different datasets together in a practical way, sort information in a smoother manner, and build more dependable analytical views. This usually happens without asking the user to deal with advanced database management or jump into programming expertise.
⇒ Organizational Impact
◈ Greater data accessibility
Giving broader reach to trusted business data lets employees sort out answers on their own, which cuts down annoying info silos a lot, and it also makes sure the key insights are there whenever either strategic or operational decisions come up.
◈ Faster reporting cycles
Self-service reporting removes long request queues, so departments can generate reports right away, respond to shifting business conditions more quickly, and make more agile decision-making, smoother and more responsive overall.
◈ Enhanced collaboration
Shared dashboards and collaborative analytics spaces help cross-functional teams work from the same data origins, which makes conversations smoother, goals line up better, and collective decision-making feel more direct across the whole organization.
Also Read: Complete List of Power BI Analytics Services for Business Growth
3. Real-Time Data Analytics and Streaming
Now, companies want to know the details and be able to act on information almost as soon as it’s collected. Real-time analytics track info and give insight into what’s going on, making it a critical part of the business intelligence puzzle.
⇒ Growing Need for Real-Time Insights
◈ Dynamic business environments
Markets are changing, as are customer habits. There can be disruptions to the way a business operates as well. Organizations must be agile enough to monitor the right performance metrics to help teams address problems before they adversely impact business operations.
◈ Demand for instant decision-making
Business executives want to know key variables now. Delayed business decisions result in lost opportunities, making it harder to stay competitive in the business environment. Immediate and accurate info means fewer decision delays and sustained opportunities.
⇒ Power BI Real-Time Capabilities
◈ Streaming datasets
With streaming datasets, Power BI can bring in and visualize ongoing updates. Streaming metrics allow real-time viewing and greater visibility into what’s occurring in the business as events unfold.
◈ Live dashboards
Live dashboards refresh visualizations automatically as new data streams come in, so stakeholders get more current performance signals for proactive monitoring and quicker operational decisions across departments. It’s like a constant pulse of metrics, though it keeps flowing in real time, which helps users act before issues become bigger.
◈ Integration with IoT and event-driven systems
Power BI integrates smoothly with IoT devices and event-driven platforms; it lets organizations gather, examine, and show live information that comes out of connected systems and day-to-day business processes in a seamless way, so the data is not just captured but also visualized as it happens, more or less.
⇒ Key Use Cases
◈ Supply chain monitoring
The integration of IoT with event-driven systems with Power BI provides real-time analytics for organizations to visualize the movement of inventory, track shipment status, assess supplier performance, analyze the operations of logistics, etc., and facilitate prompt responses to any disruption, thereby enhancing the efficacy of the logistical networks within the various nodes of the global supply chain.
◈ Financial tracking
The integration of IoT with event-driven systems with Power BI provides finance teams with real-time analytics of business transactions, movement of cash, revenue, and the budget, with a direct impact on the quality of financial decisions and operational control.
◈ Operational performance management
With the integration of IoT with event-driven systems with Power BI, organizations can monitor the performance of equipment, the productivity of the workforce, the delivery of services, and the performance of operations measured with KPIs and take corrective actions. This is an ongoing activity and is usually supported by a Power BI consulting company.
4. Advanced Data Governance and Security
As data volumes grow, advanced governance and security are getting more and more essential, not just optional. Among the most important Power BI trends 2026, these capabilities improve data protection, regulatory compliance, fine-tuned access control, and safer cooperation across teams.
⇒ Increasing Focus on Data Protection
◈ Regulatory compliance requirements
Data privacy regulations are always changing. Organizations need to adopt stronger controls to avoid harm to their reputation and the possibility of receiving a fine for non-compliance. Stronger controls are required for data access, storage, and usage, as well as for reporting.
◈ Growing cybersecurity concerns
Businesses are motivated to strengthen their protection of sensitive information and their protection of security analytics because of an increase in attacks from cyber criminals and a rapid increase in cyberattacks.
⇒ Power BI Security Enhancements
◈ Row-level security (RLS)
Row-Level Security (RLS) improves the governance of analytics environments. RLS ensures confidentiality is maintained by limiting the data that employees are permitted to see based on the employee’s role and permission.
◈ Sensitivity labels
Sensitivity labels help organizations sort business information based on what security needs are, like defining who can access what. This way, users can notice protected material, put the right safeguards in place in a consistent way, and back up regulatory compliance efforts.
◈ Data loss prevention policies
Data loss prevention policies can be utilized by a business to protect sensitive information from being inappropriately shared and to help automate the imposition of protections. The policies are focused on protecting a business from exposure of sensitive reporting data.
⇒ Benefits for Enterprises
◈ Improved compliance
More advanced governance capabilities support regulatory adherence by running access controls, keeping audit trails, safeguarding sensitive information, and assisting organizations with industry-specific compliance needs in a smoother and more effective way.
◈ Secure data sharing
Teams can collaborate with more confidence by sharing reports and dashboards securely, making sure authorized access stays in place while confidential information is protected using enterprise-grade security measures and governance controls.
◈ Better risk management
Companies can spot hidden vulnerabilities, reduce security threats, strengthen their governance practices, and lower day-to-day operational risks by staying on top of things proactively, plus getting support and guidance from seasoned Power BI consulting services professionals.
5. Fabric Integration and Unified Data Platforms
By consolidating key data and analytics capabilities into one environment, Microsoft Fabric removes traditional silos and enables a more integrated approach to managing and analyzing data. And as one of the more notable Power BI trends, it streamlines data management and accelerates insights.
⇒ The Rise of Microsoft Fabric
◈ Overview of the Microsoft Fabric ecosystem
Microsoft Fabric brings together several data and analytics services into one broader environment, so organizations can manage, process, analyze, and then visualize their enterprise data through one connected platform setup.
◈ Relationship between Power BI and Fabric
Power BI is the visualization and reporting layer inside Microsoft Fabric, letting users turn centralized data into practical insights while also using the integrated analytics features across different workloads.
⇒ Benefits of Unified Analytics
◈ Centralized data management
Centralized data management helps organizations keep things more uniform inside, supports stronger governance practices, makes day-to-day administration simpler, and gives users dependable access to reliable information assets in a way that feels more cohesive.
◈ Reduced data silos
By connecting diverse data sources inside one shared ecosystem, organizations remove annoying information silos, boost visibility across departments, and help people reach a deeper business understanding and even better collaboration.
◈ Streamlined workflows
With integrated analytics workflows, there’s less manual data movement, teams can coordinate more smoothly, reports can be implemented faster, and it ends up feeling like a more efficient space for managing analytics initiatives.
⇒ Business Value
◈ Improved scalability
A unified, cloud-based setup helps handle larger data volumes and rising analytics needs, so organizations can grow their capabilities without much infrastructure complexity. It also avoids annoying performance limits.
◈ Enhanced analytics performance
By bringing processing together and tuning data management, the system improves how fast analytics run. That means users reach useful insights quicker, do complicated analyses with less friction, and generally make decisions on time.
◈ Lower operational complexity
Organizations can reduce that technology sprawl a lot, make day-to-day system administration simpler, and generally improve how resources get used, often with help from a skilled Microsoft Power BI consultant, experienced in unified analytics implementations.
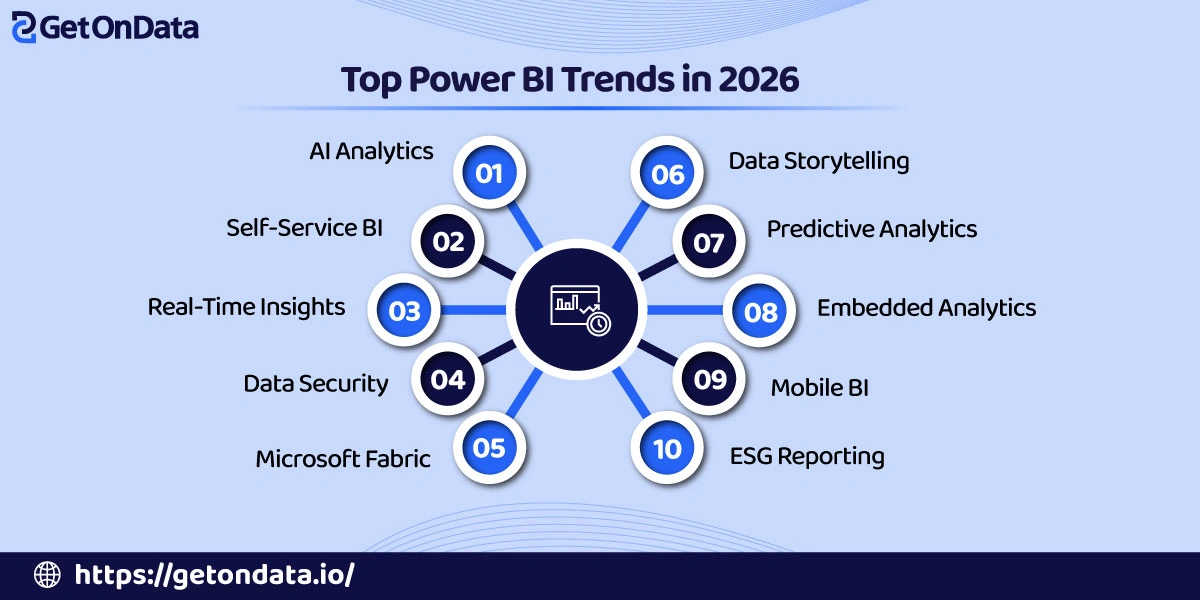
6. Data Storytelling and Interactive Visualization
Data storytelling blends visual cues with context and an ongoing narrative, so the insights feel more meaningful. Among emerging trends, Power BI users are leaning into interactive experiences, which help decision-makers grasp information faster and then act with more certainty.
⇒ Beyond Traditional Reporting
◈ Importance of visual communication
Good visual communication turns complicated datasets into stories that are easier to follow, allowing decision-makers to identify patterns quickly, understand business performance in a smoother way, and also share insights clearly across different stakeholder groups.
◈ Making insights actionable
Putting data in a suitable business setting helps users get past merely looking at numbers, so they can actually notice patterns. It also helps them figure out chances, settle on which steps to do first, deal with obstacles, and then make better strategic calls with more confidence.
⇒ Emerging Visualization Trends
◈ Interactive dashboards
Interactive dashboards let users explore the data independently, using filters, drill-down functionality, plus real-time interactions too, so they gain a bit more analytical flexibility, and it also supports a more personal decision-making experience.
◈ Dynamic reporting experiences
Dynamic reports adapt to whatever users pick, also when the data gets updated, and when business needs to shift a bit. They end up giving the right type of insight, so the report is easier to use, more engaging, and generally more effective for analysis across teams and groups.
◈ Personalized visualizations
Personalized visualizations bring the analytics experience closer to each user’s role and goals, plus whatever preferences they have, so stakeholders get access to the most useful information for their day-to-day responsibilities and decision-making needs.
⇒ Impact on Decision-Making
◈ Better stakeholder engagement
Visually compelling analytics decks tend to pull more stakeholder involvement in; they also smooth out communication when people are debating things, and they help teams more quickly line up around the same business aims and performance indicators that matter.
◈ Improved understanding of complex data
Advanced visual methods make multidimensional datasets feel much more manageable, so that people can grasp connections, directions, and odd outliers more easily, even if they do not have great analytical skills or a solid technical background.
◈ Faster insight adoption
With intuitive visualizations, users tend to read and understand the material quickly, which speeds up decision-making efforts and makes it more likely that the findings will be accepted and then turned into actual, meaningful actions.
7. Predictive and Prescriptive Analytics
The use of predictive and prescriptive analytics allows firms to understand possible future states, approximate future opportunities, decrease future uncertainties, and develop advanced solutions, all of which result in a sustainable advantage in dynamic marketplaces.
⇒ Evolution from Descriptive Analytics
◈ Moving beyond historical reporting
Much of traditional reporting is focused on assessing previous performance. Predictive analytics looks beyond this to assess trends, enabling firms to escape the pattern of reactive decision-making and to establish proactive strategic initiatives.
◈ Forecasting future outcomes
Innovations in forecasting allow more accurate predictions of demand and related operational hurdles based on the combination of historical and real-time data and the trends that are emerging in the marketplace.
⇒ Power BI’s Predictive Capabilities
◈ Integration with Azure Machine Learning
The use of Azure Machine Learning in conjunction with Power BI allows firms to build, deploy, and directly use predictive models from Power BI, and makes complex analytics outputs directly consumable and translatable to actual business solutions.
◈ Forecasting tools
Built-in forecasting tools help users identify coming trends, project performance outcomes, and approximate business metrics from patterns in past data without needing a whole lot of data science expertise.
◈ Advanced analytics models
Various departments and functional areas contribute to the execution of business processes. Complex analytical models reveal hidden relationships and patterns and provide insightful predictions.
⇒ Business Applications
◈ Demand forecasting
Prediction of future product demand becomes easier with forecasting models. Forecasting helps maintain optimal inventory levels and assists with supply chain efforts. Overstocking and inventory shortages become less of a concern.
◈ Risk assessment
Predictive models perform assessments for various risks within operational, financial, and compliance realms. Predictive models signal warnings that allow for risk mitigation before constraints affect business objectives.
◈ Customer behavior prediction
Organizations can translate purchase patterns, engagement, and preferences into predicted customer behavior. A dedicated Power BI consultant in Chicago can help along the way.
8. Embedded Analytics for Enhanced User Experiences
Embedded analytics integrates business intelligence right into apps, portals, and even the actual products, so insights show up exactly where decisions happen. It is, honestly, one of the really impactful Power BI trends that tends to improve the overall user experience a lot.
⇒ What is Embedded Analytics?
◈ Definition and growing adoption
Embedded analytics blends reporting, dashboards, and data visualization right into everyday business applications, so users can grab insights inside their current workflows, and it helps with efficiency too, while also speeding up the whole decision process.
◈ Importance for software providers
For software providers, embedded analytics is a way to bring extra value, set their products apart, and make the customer experience feel more secure. It also brings data-driven functionality that supports wider product take-up and helps with long-term user retention.
⇒ Power BI Embedded Features
◈ Integration into applications and portals
Power BI lets you integrate dashboards and reports into apps, websites, and different portals, so people can tap into the analytics without basically stepping out of where they already work. It feels seamless, not like some separate thing.
◈ Custom analytics experiences
Organizations can personalize visualizations, brand presentation, access permissions, and the reporting dashboards to shape a personalized analytics experience that fits real user needs, day-to-day workflows, and the specific business aims.
⇒ Benefits
◈ Improved user engagement
When analytics are built into the everyday applications people already use, it tends to bring them back more often, with less friction, and they can decode the data sooner. This helps users pick better choices with a steadier pace, while also boosting overall engagement on digital services.
◈ Revenue opportunities
With embedded analytics, there are chances to add premium reporting features, upgrade subscriptions, and bundle value-added services, so teams can bring in additional revenue just from their analytics capabilities.
◈ Seamless access to insights
Users get immediate access to the relevant business intelligence, without having to switch platforms at all, and honestly, that capability usually ends up working pretty well when it’s put in place with help from a seasoned Microsoft Power BI consultant, focused on embedded analytics solutions.
9. Mobile-First Analytics and Accessibility
With mobile-first analytics, decision-makers get steady access to reports and insights from wherever they are, which helps them respond more quickly to shifting business conditions and also keeps distributed teams more supported, in a practical sense.
⇒ Rise of Mobile Business Intelligence
Smart devices have made work data easier to approach for many professionals. Employees at all levels now access reports, track KPIs, and make data-based business decisions on mobile devices. Consequently, the demand for mobile analytics that provide secure and instantaneous insights has only grown.
⇒ Power BI Mobile Enhancements
Power BI enhances mobile experience by offering flexible dashboards and reports tailored to the mobile form. Fitting the user interface to mobile design, Power BI sends updates, notifications, and alerts to business professionals on the go who have no access to workplace analytics.
⇒ Business Advantages
Mobile analytics help businesses grow by allowing them to adapt to rapid changes like shifting customer preferences or new opportunities. Immediate insight helps with productivity, decision-making, and inter-team cooperation. Enhanced accessibility means employees stay connected and can easily see performance metrics, regardless of time and place.
10. Sustainability and ESG Reporting
Business intelligence platforms help organizations gather, study, and share ESG data more smoothly, which in turn supports better transparency, stronger accountability, and measurable sustainability outcomes as stakeholder expectations continue to grow.
⇒ Growing Importance of ESG Metrics
Environmental, Social, and Governance reporting has grown from being a voluntary thing into a strategic requirement. Regulators, investors, customers, and business partners increasingly expect organizations to show tangible paces toward sustainability targets and accountable ways of operating.
⇒ Power BI for Sustainability Analytics
With Power BI, organizations can pull together ESG information from many different sources, then turn it into useful charts and dashboards, so you can follow sustainability metrics more easily and automate the whole reporting routine. In practice, this lets the business stay aware of environmental performance, while also increasing reporting precision and overall efficiency.
⇒ Strategic Benefits
A strong ESG reporting setup can make things clearer, help with compliance work, and also build stakeholder trust, as it makes the whole story more readable. In practice, organizations can communicate sustainability wins in a better way, identify areas for refinement, and grow a more solid market reputation, often with support from a skilled Power BI expert in Chicago.
Also Read: Power BI Consultant in USA for Scalable Business Intelligence Solutions
Best Practices for Leveraging Power BI Trends
To harness more Power BI trends, companies should consider using strategic practices that provide long-term adaptability, improved governance, and more analytics usability.
✦ Invest in Data Literacy
Training employees using analytics empowers them to understand data, develop skills using reporting instruments, and make better decisions. Having a data-centric culture results in frequent analysis use throughout organizations.
✦ Establish Strong Governance
Clearly defined data ownership ensures accountability and improves information quality. Having security policies enables the protection of sensitive information, supports compliance, and builds trust in analytical frameworks.
✦ Focus on Scalability
An analytics infrastructure designed with scalability in mind provides organizations with the frameworks necessary to operate regardless of data volume constraints. Cloud-based infrastructure helps with performance and availability scalability without stretching the limits of the infrastructure.
✦ Continuously Monitor Emerging Features
Staying updated with the latest Microsoft updates can help organizations adapt to the latest modifications and optimizations. Keeping an eye out for the newest Power BI features can help organizations adapt and optimize their analytics strategies.

Ready to Future-Proof Your Business Intelligence Strategy?
AI analytics, real-time analytics, predictive analytics, Microsoft Fabric, embedded analytics, and ESG reporting constitute the new landscape of business intelligence and analytics.
New BI technologies are proving their fiscal value with processes and capabilities that make data more accessible, improve governance and analytical depth, and produce insights that lead to measurable outcomes.
The evolution of more capable AI, Automation, intelligent analytics, and integrated data ecosystems will shape the future of Power BI and make the simplification of complex decisions even more possible.
Businesses will need to build more flexible infrastructures and stronger data governance and analytics to grab the benefits of future innovations. Partnering with a professional Power BI services company will help your business dive ahead.